Absolute Value Function Transformations Made Easy
Absolute value function transformations begin with a simple parent graph: y = |x|, a V shape with its vertex at the origin and symmetry about the y-axis. From that starting point, you only need a few rules to move the graph up, down, left, or right, and to make it wider, narrower, or upside down. Once you know how each number affects the equation, sketching becomes much faster and more reliable.
Parent graph basics
source: Pinterest
source: Math Stack Exchange
The parent function y = |x| has two straight rays that meet at (0, 0). For every x-value, the output is the distance from zero, so the graph is always nonnegative and equally steep on both sides. That symmetry is the key feature to preserve when transforming it. A quick sketch usually starts by plotting the vertex, then using points like (1, 1) and (-1, 1) to form the V shape.
Shift, stretch, reflect
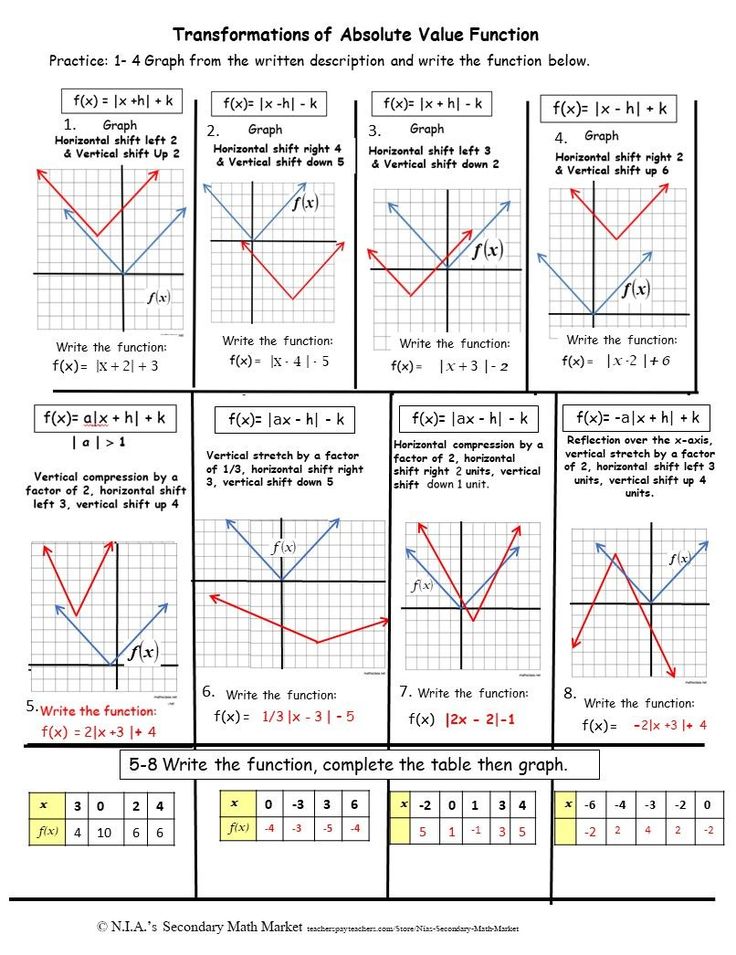
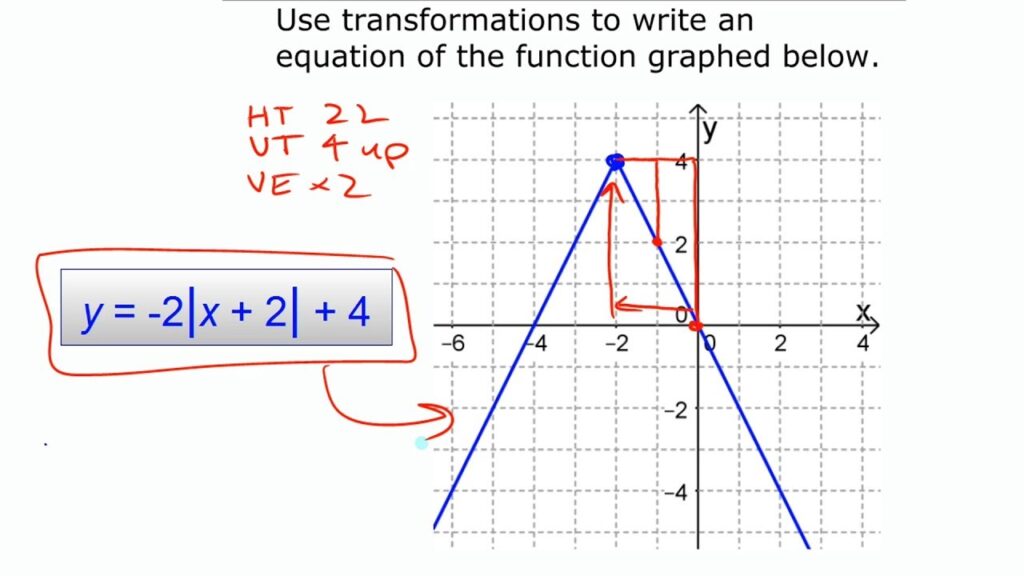
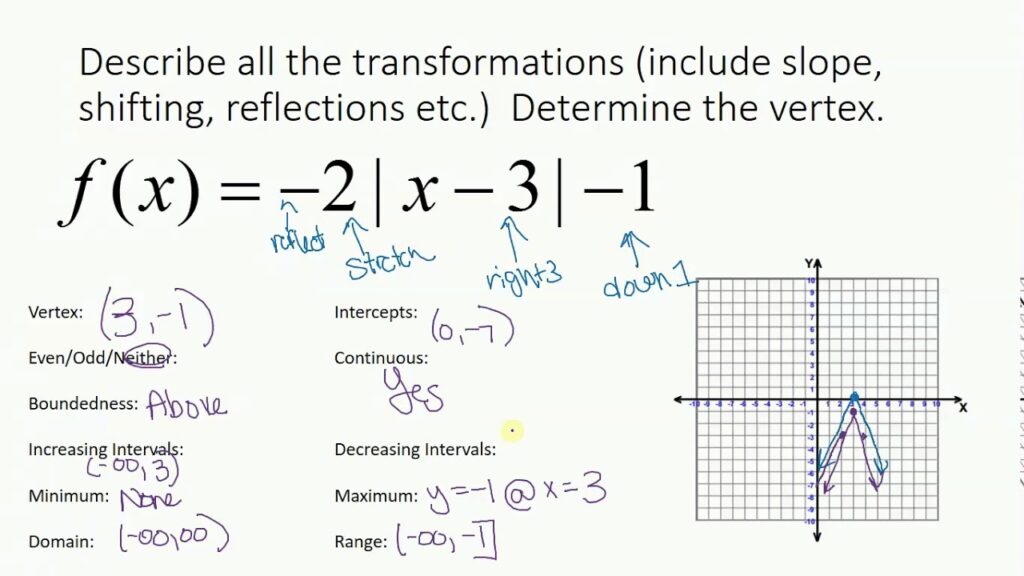
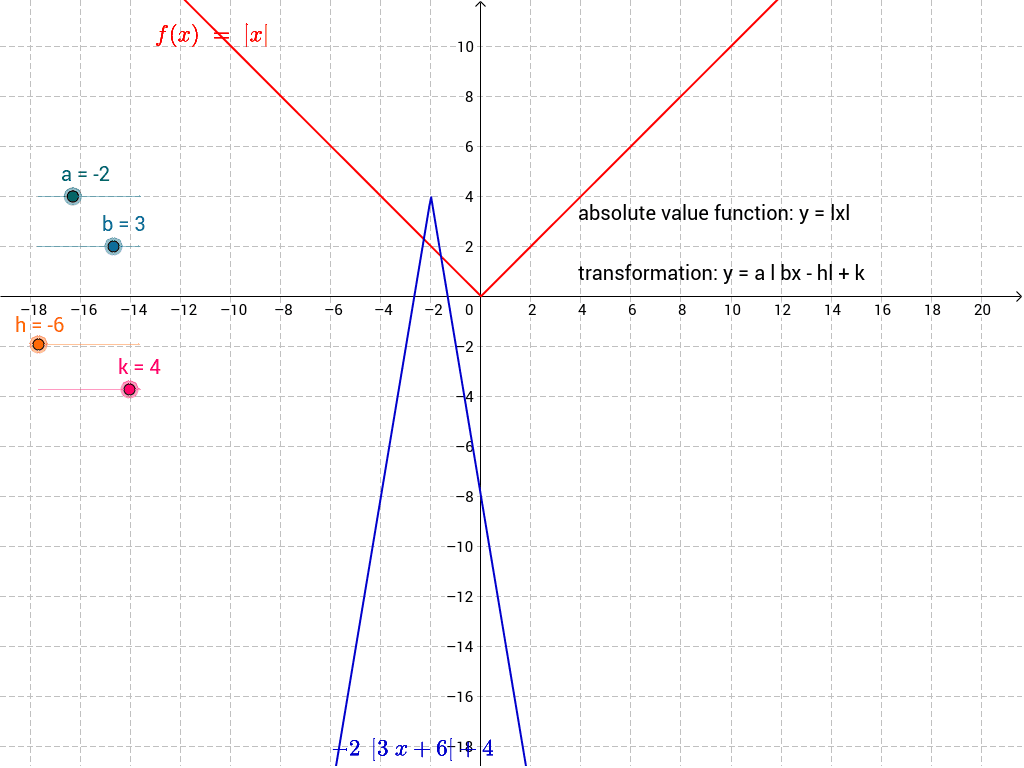
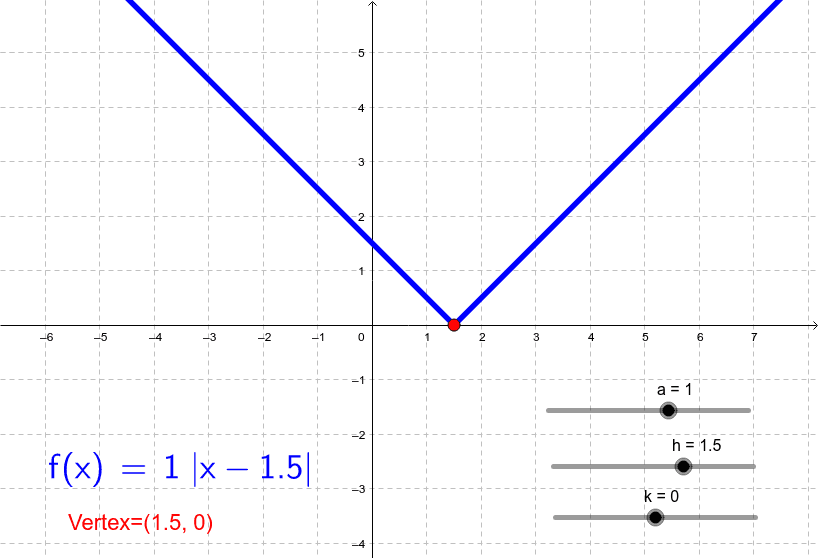
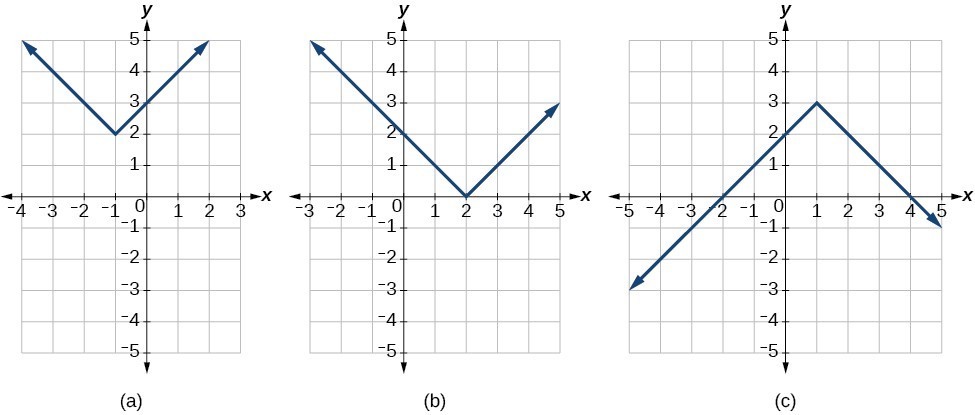
In y = |x – h| + k, the graph shifts right h units and up k units, so the vertex moves to (h, k). A negative inside changes the direction of the horizontal shift, while a negative outside reflects the graph across the x-axis. Multiplying the absolute value by a number a gives y = a|x|. If |a| > 1, the V becomes steeper; if 0 < |a| < 1, it becomes wider.
source: YouTube
source: YouTube
source: GeoGebra
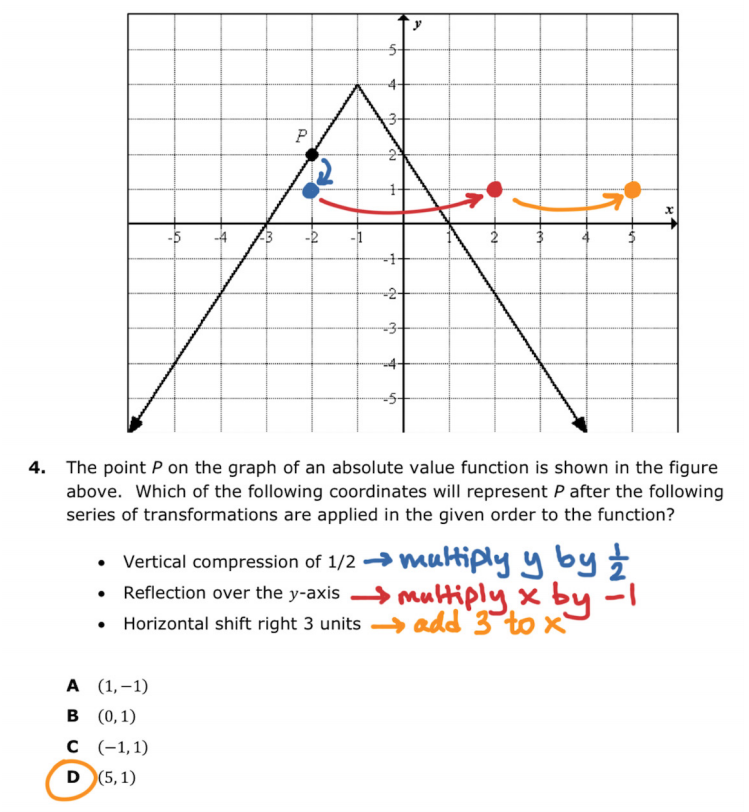
A simple way to graph a transformed absolute value function is to read it in order: identify the horizontal shift, then the vertical shift, then the factor outside the absolute value, and finally any reflection. For example, y = -2|x + 3| + 1 shifts left 3, up 1, reflects over the x-axis, and stretches vertically by 2. Plot the new vertex first, then use the slope pattern to build the arms. With practice, the form of the equation tells the whole graph quickly.
source: GeoGebra
source: Lumen Learning